Reprinted with permission. BJUI Compass. 2025;6(12):e70131.*
by Rachel Weng, Tran Anh Thu Phung, Robert Bell, Lars Dyrskjøt, and Ewan A. Gibb
Drs. Weng, Phung, Bell, and Gibb are with Vancouver Prostate Centre, M. H. Mohseni Institute of Urologic Sciences, in Vancouver, Canada. Dr. Dyrskjøt is with Department of Clinical Medicine, Aarhus University, Aarhus, Denmark. Dr. Gibb is additionally with Department of Urologic Sciences, University of British Columbia, in Vancouver, Canada.
*Copyright: © 2025, the authors. BJUI Compass published by John Wiley & Sons Ltd on behalf of BJU International Company. This article is an open-access article distributed under the terms and conditions of the Creative Commons Attribution (CC BY) license (http://creativecommons.org/licenses/by/4.0/). The article may have been modified to adhere to journal style.
FUNDING: No dedicated funding supported this study. EAG acknowledges start‐up funds from the Vancouver Prostate Centre/UBC.
DISCLOSURES: The authors declare no conflicts of interest.
ABSTRACT: Background: To evaluate whether long noncoding ribonucleic acid (lncRNA) expression patterns can improve molecular stratification and outcome prediction in high‐risk non‐muscle‐invasive bladder cancer (NMIBC). Methods: RNA sequencing data from high‐grade Ta (TaHG) and T1 (n=212) tumors from the UROMOL consortium (Lindskrog et al, Nature Communications 2021) were analyzed. Unsupervised consensus clustering based on lncRNA expression patterns identified distinct patient subgroups, which were characterized using gene expression patterns and gene signatures. A single‐sample classifier was trained using elastic net logistic regression on UROMOL lncRNA expression profiles and applied to the Knowles cohort for independent validation. Recurrence‐free survival (RFS) and progression‐free survival (PFS) were evaluated using Kaplan–Meier (KM) plots and univariate and multivariate analyses. Results: LncRNA expression patterns identified 3 distinct clusters of TaHG and T1 tumours (LC1, LC2, LC3). Of these, the LC1 subgroup (n=47) had significantly better RFS (P=0.04) and PFS (P=0.002). The LC1 subgroup was characterized by downregulation of genes associated with proliferation (ie, FOXM1, MKI67) and lower G2M and E2F gene signatures, suggesting reduced rates of tumor growth. A transcriptomic classifier trained on UROMOL lncRNA profiles successfully stratified recurrence risk in an independent validation cohort (Knowles, n=120), where predicted high‐risk cases (LC2/3) demonstrated significantly poorer RFS (P<0.001). While these findings highlight lncRNA expression as a potential stratification tool, limitations include the retrospective design, treatment heterogeneity, and the need for external validation. Conclusion: LncRNA‐based clustering demonstrates significant potential for improving patient stratification in high‐risk NMIBC, identifying less aggressive tumors in an otherwise high‐risk setting. A transcriptomic classifier trained on these findings was successfully validated in an independent cohort, supporting its potential clinical utility in refining risk assessment and guiding treatment decisions. Prospective studies are needed to further validate and refine this approach. Supplementary Information: The online version contains supplementary material available at doi: 10.1002/bco2.70131. Keywords: Biomarkers, gene expression profiling, high‐risk bladder cancer, noncoding RNA, risk stratification
Background
High‐risk non‐muscle invasive bladder cancer (NMIBC), which includes both high‐grade stage Ta (TaHG) and T1 tumors, is a heterogeneous disease with variable clinical outcomes.1,2 Patients with high‐risk NMIBC face a substantially elevated risk of both recurrence and progression, often necessitating early and aggressive treatment strategies.2–4 Standard‐of‐care for high‐risk disease involves transurethral resection of the bladder tumor (TURBT) followed by intravesical Bacillus Calmette‐Guérin (BCG) immunotherapy. Despite this approach, long‐term disease control is achieved in only approximately 40% of patients, spurring the investigation of numerous alternative therapeutic options in clinical trials.5–9 Accordingly, there remains a critical unmet need for biomarkers that can enhance patient stratification and more accurately identify which patients require escalated therapeutic interventions as well as those who could safely be de‐escalated.
Gene expression‐based molecular subtyping has been used to investigate tumor biology in muscle invasive bladder cancer (MIBC), where it has potential as a prognostic and predictive biomarker.10–14 Broadly, MIBC can be divided into luminal and nonluminal, including basal‐squamous and neuroendocrine‐like, with later frameworks such as the Lund taxonomy providing additional granularity.15–18 When these MIBC models are applied to NMIBC, however, nearly all tumors are classified as luminal‐papillary or UroA, which limits their clinical utility in this setting.19–21 Accordingly, NMIBC‐specific classification systems have been developed, particularly for high‐risk disease, with UROMOL 2021 providing the most extensively validated classifier, while other models remain less well tested in external cohorts.22
In high‐risk NMIBC, transcriptome‐based subtypes have also advanced understanding of tumor biology and clinical behavior.22 The UROMOL 2021 study defined 4 classes across a large cohort of Ta and T1 tumors and linked them to distinct outcomes, with Class 2a associated with poorer recurrence-free survival (RFS) and progression-free survival (PFS), and Class 1 with more favorable prognosis.19 Other groups have reported alternative 3‐class or 5‐class solutions for T1 disease, with distinct biology and associations with BCG response or recurrence (for example, BRS1–3; T1‐Myc, T1‐Luminal, T1‐Inflammatory, T1‐Early and T1‐MYC‐enriched) across cohorts of varying size.20,23 Stage‐stratified approaches have further identified Ta‐focused expression groups (TaE1–E3) and T1‐focused clusters (T1E1–E4), with differences in recurrence risk and treatment outcomes.24 Collectively, this body of work has shown that transcriptional programs capture clinically relevant heterogeneity in high‐risk NMIBC, but variability in cohort size, analytic platforms and external validation has limited the translation of any single scheme into routine practice.
Messenger ribonucleic acid (mRNA) expression profiles have been expanded to include long noncoding RNA (lncRNA) profiles in efforts to identify biomarkers for bladder cancer.11,25–27 LncRNAs are mRNA‐like transcripts that are at least 200 nucleotides long but lack functional open reading frames, and they may or may not be polyadenylated.28,29 These transcripts often constitute a significant portion of the transcriptome, and while their biological roles are not yet fully understood, their expression is often highly tissue‐specific or disease‐specific, suggesting their strong potential as biomarkers.30,31 In bladder cancer, lncRNA expression profiles have been shown to define clinically relevant subdivisions, identifying patients with prognostic potential in both MIBC and NMIBC or those with micropapillary‐like disease in luminal T1 NMIBC.11,16,25,32,33
In this study, we queried the UROMOL database of high‐risk NMIBC samples and identified a subgroup of patients with high‐risk NMIBC with less aggressive biological profiles. These patients have lower rates of recurrence and progression events and may be candidates for treatment de‐escalation.
Materials and methods
Patient cohorts. Patient cohorts were obtained from the UROMOL consortium19 and the Knowles study,24 both of which included gene expression profiles and clinical annotations. For UROMOL, bulk RNA sequencing data and normalized expression profiles were previously described and are available in the supplementary materials of the 2021 publication. For Knowles, microarray data generation and processing were previously reported. In this study, we focused on high‐risk, TaHG and high-grade T1 (T1HG) tumors, analyzing 212 cases from UROMOL and 120 cases from Knowles.
Gene expression profiling. Details regarding the generation of RNA‐seq profiles for the UROMOL cohort have been previously described,19 and normalized gene expression data were provided in the supplementary materials of that study. Microarray data for the Knowles cohort were similarly generated and published in prior work.24
Unsupervised consensus clustering. Using Ensembl 112 (May 2024), we identified 9,139 lncRNA features that were available among the UROMOL gene expression data matrix. The lncRNA expression data were preprocessed using median absolute deviation (MADS) to identify highly variant lncRNA features for unsupervised clustering analyses (R package ConsensusClusterPlus, ver. 1.70.0). Unsupervised consensus clustering was performed on gene sets ranging from 500 to 2,000 gene features. Outputs from ConsensusClusterPlus (including tracking plots, delta plots and cumulative distribution function [CDF] plots) were evaluated, and a 1,000‐gene feature solution was selected as most appropriate and informative. The expression clustering analysis was performed using the partitioning around medoids (PAM) algorithm and Pearson correlation distance, with Ward’s minimum variance method (Ward.D2) used for hierarchical clustering. Clustering was performed for 500 iterations, resampling 95% of samples (pItem=0.95) in each iteration.
Classification of tumors into molecular mRNA subtypes. To assign tumours to the mRNA‐based molecular bladder cancer subtypes, we downloaded R packages ‘consensusMIBC’ and ‘BLCAsubtyping’ from GitHub and applied the Consensus and The Cancer Genome Atlas (TCGA) subtyping models to the normalized expression data, respectively.15 For the LundTax subtypes, we downloaded and applied the package ‘LundTaxonomy2023Classifier’ from GitHub.34 The UROMOL2021 subtyping classes were available as part of the supplemental data from the corresponding manuscript.19
Gene expression analyses. Heatmaps and boxplots were used to visualize differences between de novo generated unsupervised lncRNA‐based consensus clusters (LCs), using cluster‐specific selected lncRNAs, genes, and hallmark gene sets from the molecular signature database hallmark gene set collection (MSigDB).35 The sonic hedgehog (SHH) pathway and immune190 score calculations have been described previously.11 For all differential expression and pathway analyses, false discovery rate (FDR) correction was applied using the Benjamini‐Hochberg method to account for multiple testing.
Statistical analyses. All statistical analyses were performed using R statistical software (R Foundation for Statistical Computing, Vienna, Austria). Patient and tumor characteristics were compared between subgroups by using χ2 tests and 2‐sided Wilcoxon rank‐sum tests. P values in boxplot figures represent results of Kruskal–Wallis rank sum tests when comparing multiple groups, and Wilcoxon rank sum tests when comparing 2 groups. The primary endpoints were RFS and PFS; however, PFS was not evaluated in the Knowles cohort due to a lack of progression events. Patients who were lost to follow‐up were censored at the date of last contact. The Kaplan–Meier method was used to estimate survival probabilities, and statistical significance of differences between survival curves for patients of different molecular subgroups was assessed using the log‐rank test. Multivariable analyses were performed using Cox proportional hazards models, adjusting for clinical covariates.
Discovery and validation of a transcriptomic classifier. A single‐sample classifier was trained on lncRNA expression data from the UROMOL cohort using elastic net‐regularized logistic regression (α=0.5). Patients were grouped into LC1 (favorable outcome) and LC2/3 (unfavorable outcome) subtypes based on unsupervised consensus clustering and RFS analysis. Feature selection was performed using a nested cross‐validation approach, identifying a robust set of 179 lncRNAs predictive of subgroup membership. A final elastic net model was trained on the full UROMOL cohort using this feature set, resulting in 116 lncRNAs with non‐zero coefficients. The trained classifier was then applied to the Knowles cohort to assign patients to LC1 or LC2/3 subgroups using an optimal classification threshold derived from the training data.
Results
The clinicopathological characteristics of the UROMOL and Knowles cohorts are outlined in Table 1. The UROMOL cohort (n=212) was predominantly male (80%) with a median age of 71 years. Most tumors were TaHG, and 65% of patients experienced recurrence, with 20% progressing to MIBC over a median follow‐up of 48.5 months. Intravesical treatment was common (57% received Mitomycin C [MMC], 37% BCG). The The Knowles cohort (n=120), used for validation, was similar in age and sex but had more T1HG tumors and greater use of BCG (52%), with limited MMC exposure and no tumor size data available.
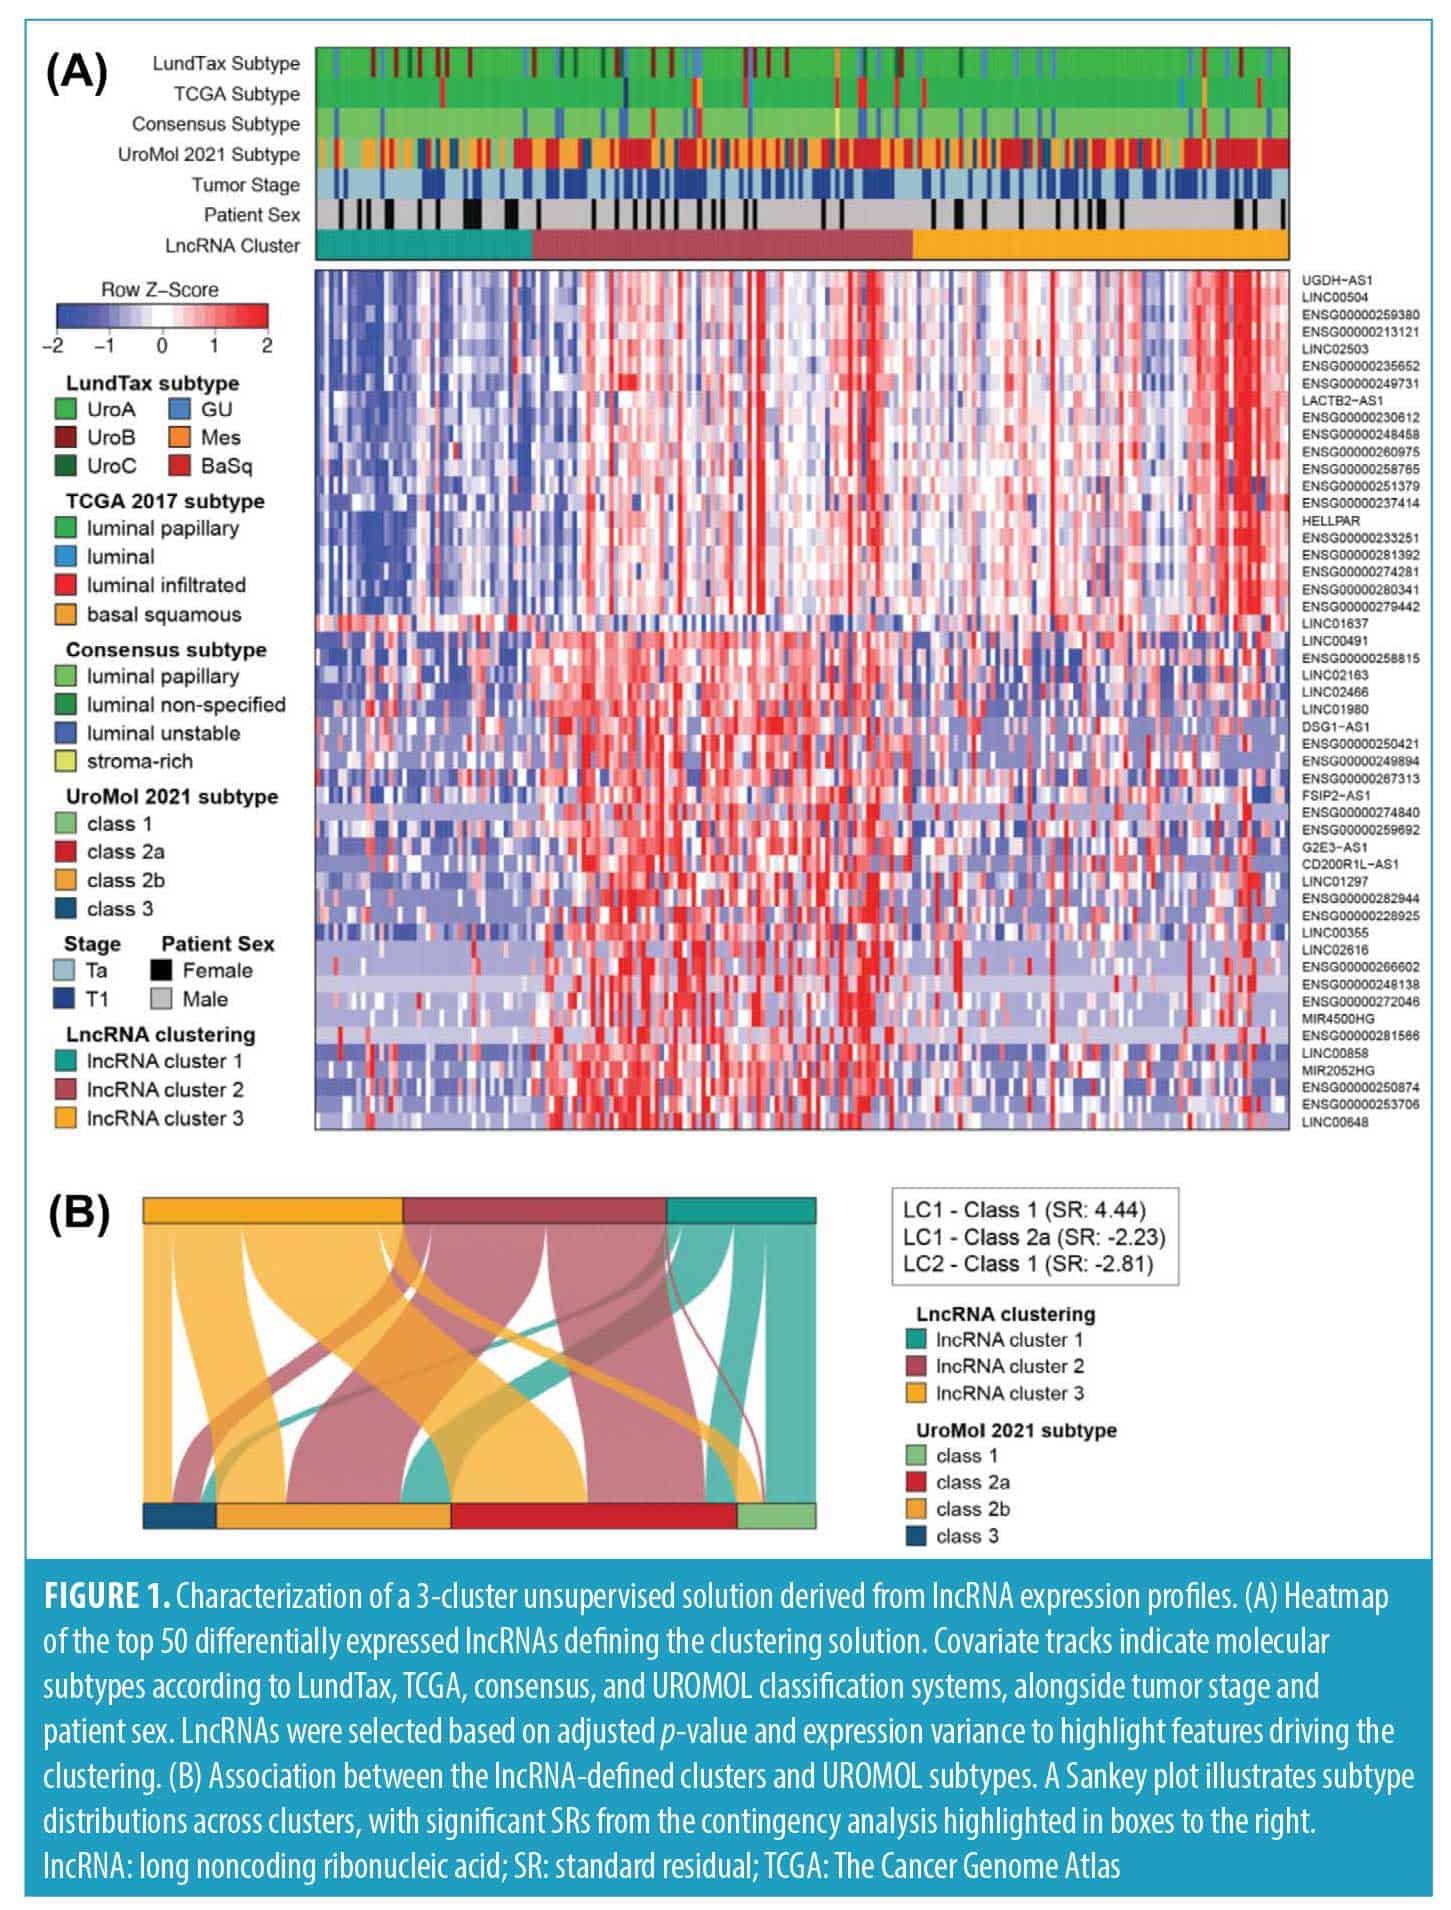
Consensus clustering of high‐risk NMIBC identified 3 groups of patients with distinct long noncoding RNA expression profiles. Unsupervised consensus clustering of the top 1,000 most variable lncRNAs revealed a robust 3‐cluster solution (Figure S1), with strong internal coherence in 2 clusters and moderate structure in the third. To identify cluster‐enriched lncRNAs, we performed differential expression analysis comparing each cluster against the remainder of the cohort using stringent criteria (|log2FC| >1; FDR‐adjusted P<0.05). This yielded 342, 164, and 55 significantly differentially expressed lncRNAs in clusters LC1, LC2, and LC3, respectively, for a total of 420 unique genes. The top 50 lncRNAs, ranked by minimum adjusted p‐value across all contrasts, were prioritized for visualization, revealing distinct expression patterns in LC1 and greater overlap between LC2 and LC3 (Figure 1A).
Cross‐comparison with established subtyping frameworks confirmed strong overlap with luminal phenotypes. The majority of tumours were classified as UroA (167/212; 78.8%) by the LundTax model, luminal papillary (198/212; 93.4%) by the TCGA 2017 model and LumP (184/212; 86.8%) by the Consensus classification system (Figure 1A).
In contrast, the UROMOL 2021 subtypes were more broadly distributed across the three lncRNA clusters (Figure 1A, Table S1). LC1 was enriched for Class 1 and 2b (16/47 each), LC2 was dominated by Class 2a (37/83) and 2b (36/83), while LC3 skewed toward Class 2a (43/82). Class 3 was generally underrepresented. A χ2 test confirmed a significant association between lncRNA clusters and UROMOL subtypes (χ2=38.1, df=6, P<0.001; Table S2). Although prior UROMOL subanalyses stratified Ta low‐grade and T1HG tumors also reported additional heterogeneity at the mRNA level, these refinements did not consistently improve outcome prediction.19 These relationships are further illustrated in a Sankey plot, with dominant transitions highlighted by standardized residuals ≥ ±2, most notably LC1‐Class 1, LC1‐Class 2b and LC2‐Class 2a (Figure 1B, Table S3).
Biological characterization reveals a less aggressive expression profile in lncRNA cluster 1. As with the lncRNA analysis, we performed differential expression profiling of coding genes using identical thresholds (|log₂FC| >1; FDR‐adjusted p<0.05). This identified 564, 471, and 146 significantly differentially expressed genes in clusters LC1, LC2, and LC3, respectively, corresponding to 884 unique coding genes. Heatmap visualization of these genes revealed that LC1 was the most transcriptionally distinct, though it shared some weaker structural similarity with LC3. In contrast, LC2 and LC3 exhibited broadly similar gene expression patterns, yet remained clearly distinguishable (Figure S2).
The LC1 cluster was notably depleted in many genes, including several regulators of cell proliferation and mitotic spindle formation such as MKI67, ASPM, and CENPF (Figure S2). In contrast, LC1 demonstrated elevated expression of genes associated with immune infiltration, including CCL15 and PSMB10, both linked to T‐cell recruitment. Notably, RNH1 was also upregulated; lower expression of this gene has been associated with increased invasion and metastasis in bladder cancer, suggesting a protective role in this context.
The LC2 cluster showed specific enrichment for an unusual panel of genes. These included MAGEA3, MAGEA6, and MAGEA10, all cancer‐testis antigens previously associated with higher tumor grade, stage, and risk of invasion in NMIBC. LC2 also exhibited elevated expression of NEB, a gene more commonly linked to neuroendocrine and small cell bladder cancer, as well as NELL2, which has been implicated in promoting cell viability and proliferation in bladder cancer cells. In contrast, the LC3 cluster was less distinct, sharing expression patterns with both LC1 and LC2, but without the same degree of specificity or enrichment.
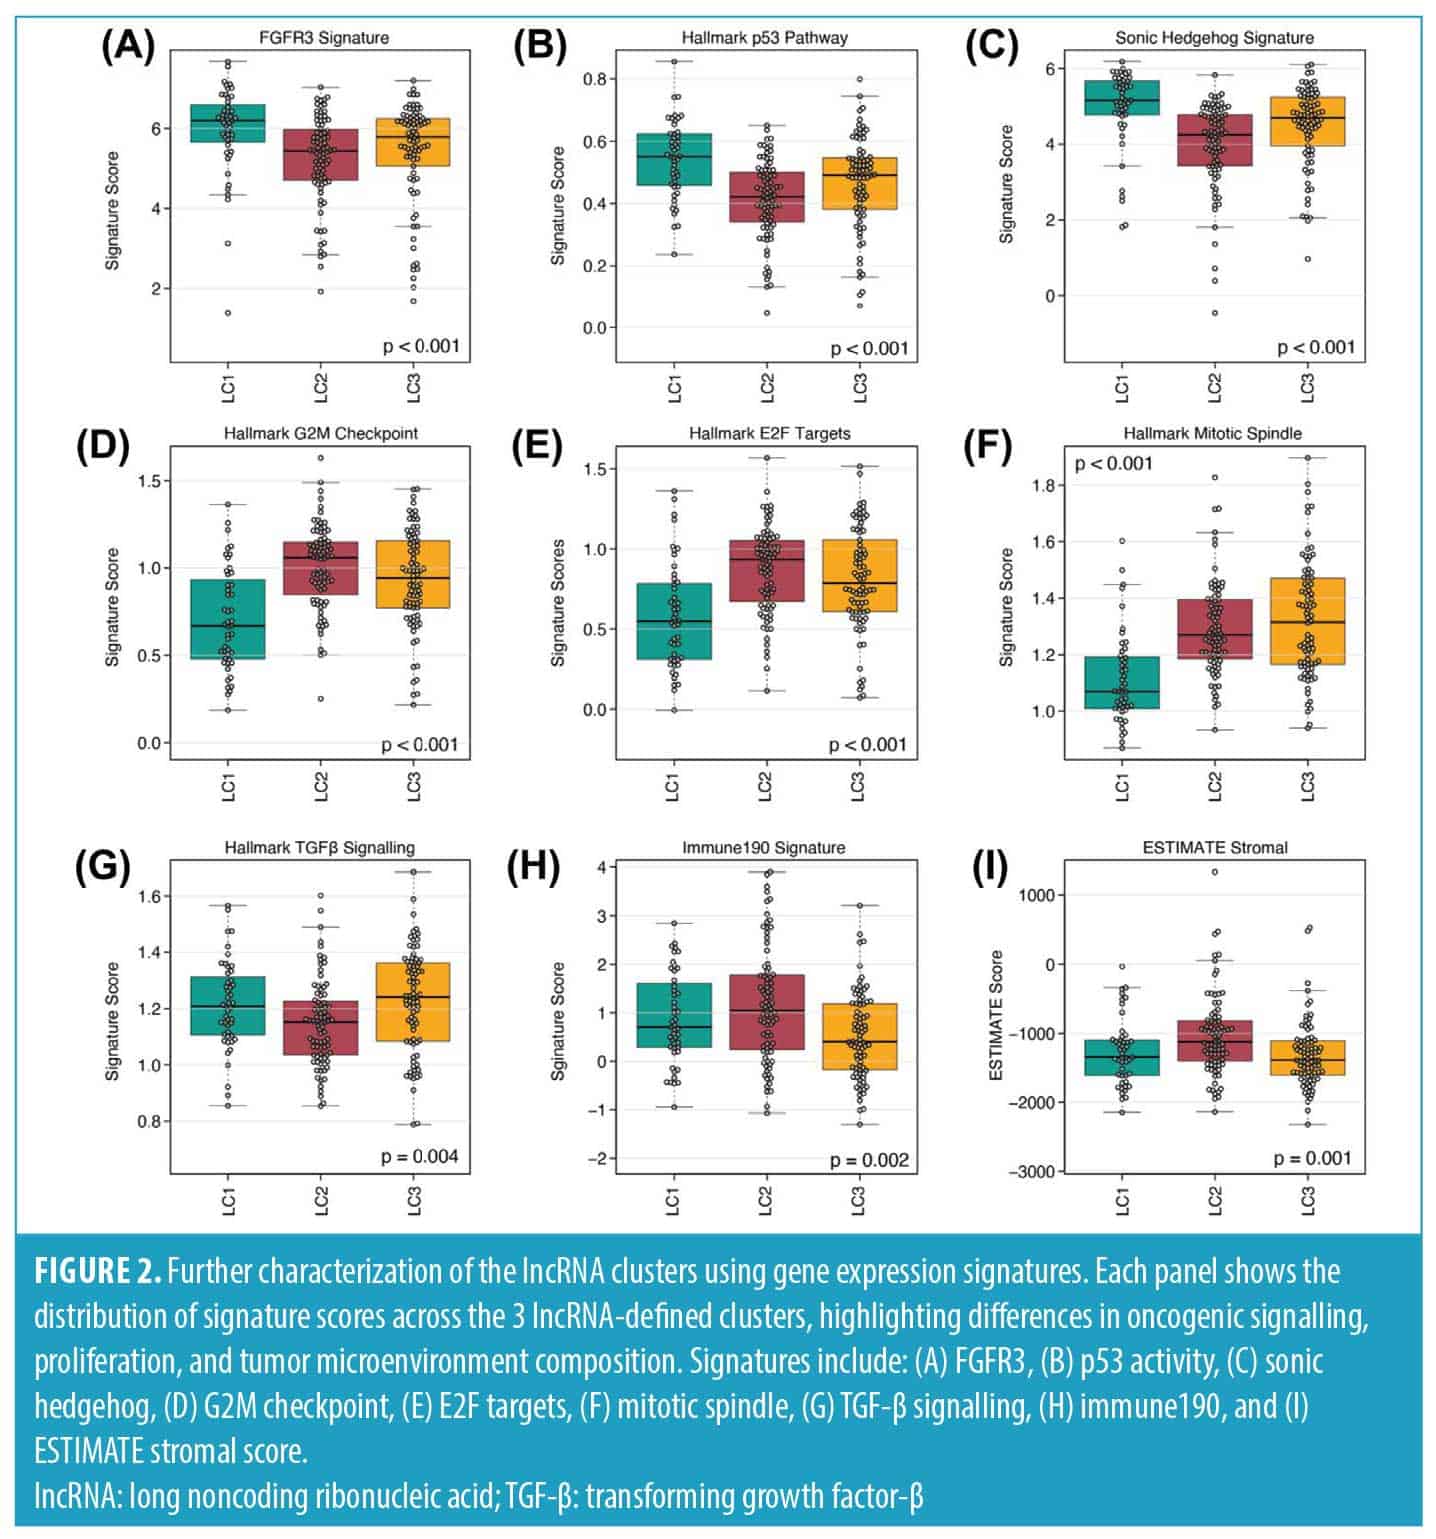
Next, we assessed enrichment of the MSigDB Hallmark collection along with selected immune‐ and stromal‐associated gene signatures. LC1 presented the highest activity scores for FGFR3, p53 and SHH pathways compared to the other clusters (Figures 2A–C). In contrast, hallmark signatures related to G2M checkpoint, E2F targets, and mitotic progression were markedly lower in LC1, consistent with a nonproliferative transcriptional profile (Figures 2D–F). By comparison, transforming growth factor-β (TGF-β) signaling, Immune190 and ESTIMATE stromal scores showed only modest intercluster differences (Figures 2G–I), indicating that the lncRNA clusters are not strongly distinguished by immune or stromal composition.
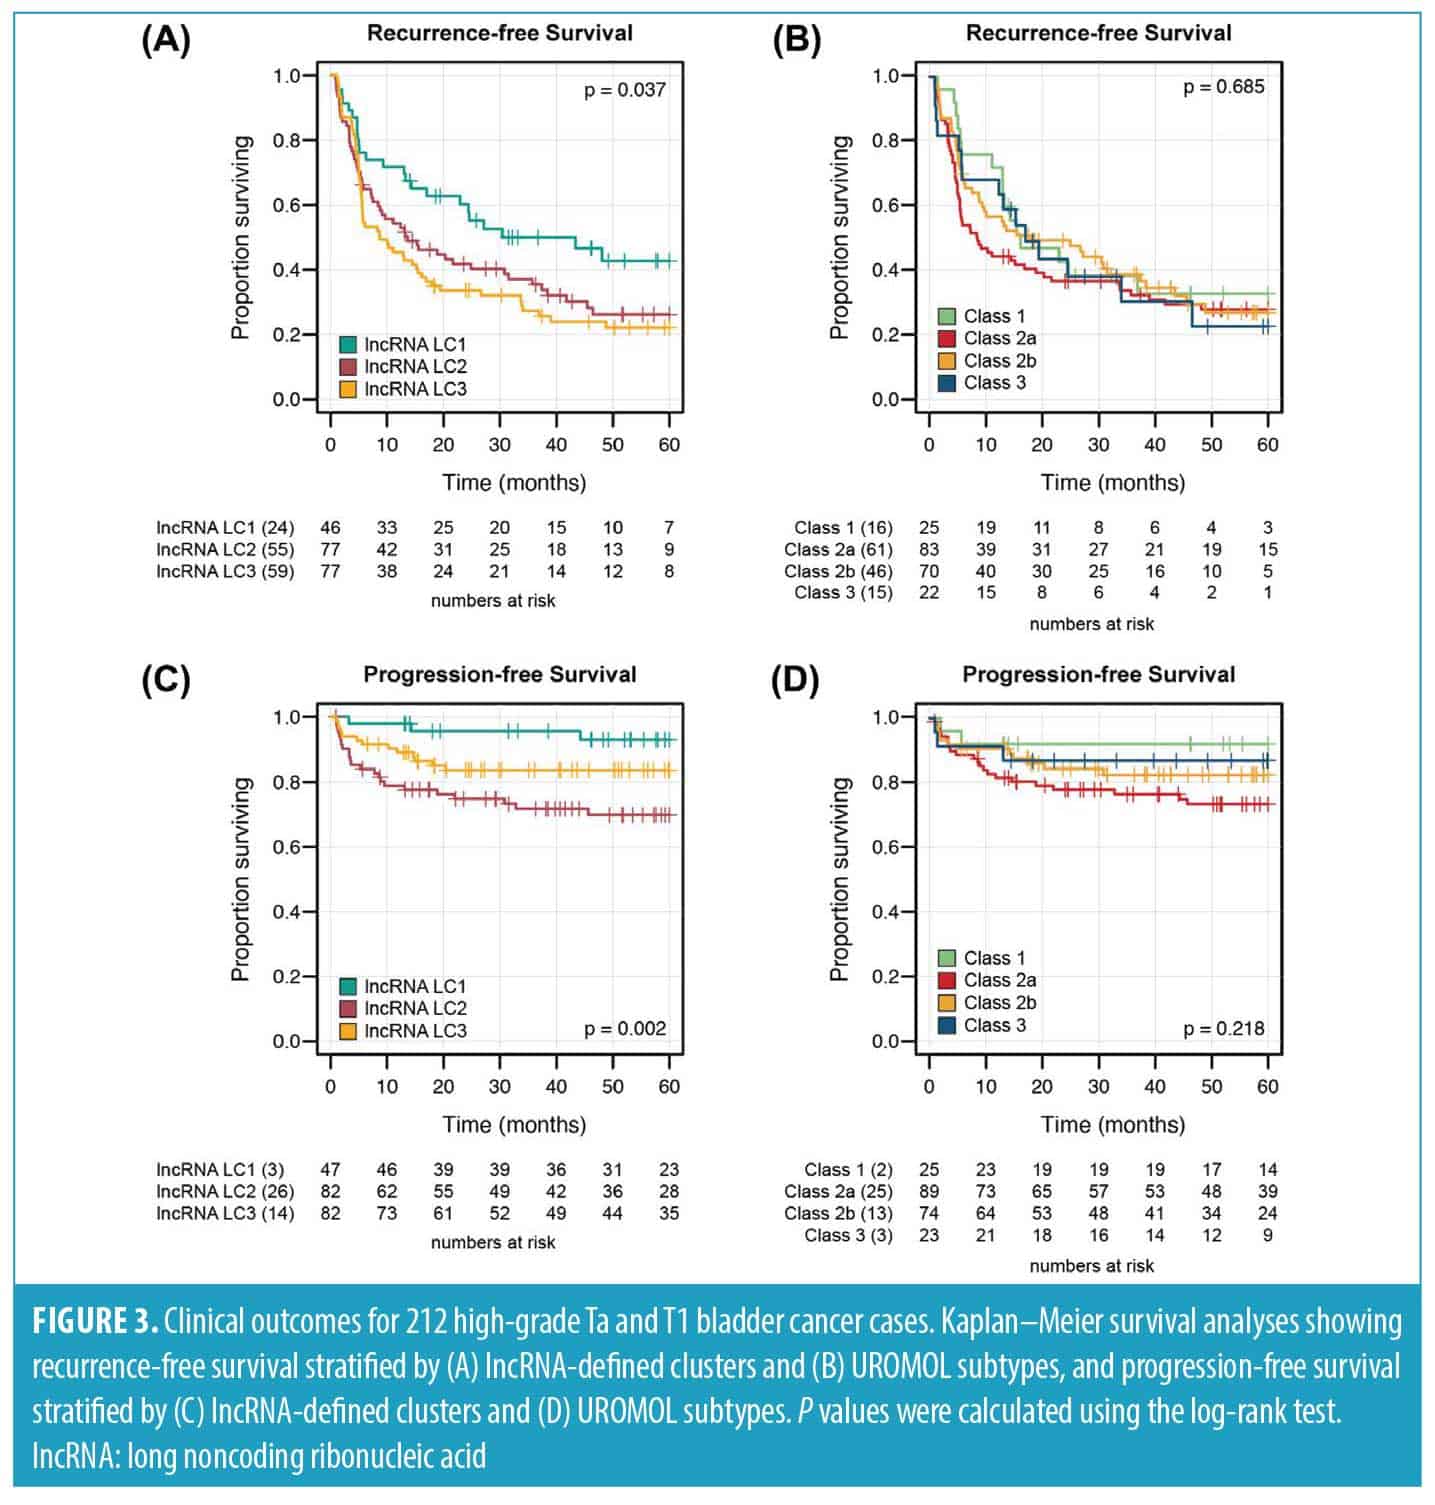
LncRNA cluster 1 is associated with reduced risk of disease recurrence and progression. To evaluate whether our lncRNA‐based clusters were associated with distinct clinical behavior, we assessed RFS and PFS using Kaplan–Meier analysis and compared these results to the UROMOL2021 subtypes (Figure 3).
For RFS, patients in LC1 demonstrated significantly improved outcomes compared to those in LC2 and LC3, which showed similar prognoses (P=0.037; Figure 3A). In contrast, the UROMOL2021 subtypes did not significantly stratify patients by recurrence risk (P=0.685; Figure 3B). For PFS, our clustering solution identified 3 groups with distinct prognosis: LC1 again showed the most favorable outcomes, while LC3 was associated with the poorest prognosis (P=0.002; Figure 3C). Although the UROMOL2021 subtypes showed a similar pattern, with Class 1 tumors having the best outcomes and Class 2a the worst, this separation did not reach statistical significance (P=0.218; Figure 3D).
Multivariable Cox proportional hazards models controling for age, sex, tumor stage, BCG treatment, and presence of concomitant carcinoma in situ (CIS) confirmed the prognostic relevance of LC1 for both RFS and PFS (Tables 2 and 3). In the RFS model, LC1 was independently associated with reduced recurrence risk (hazard ratio [HR]: 0.58; 95% confidence interval [CI]: 0.37–0.90; P=0.02; Table 2). Concomitant CIS was also significantly associated with increased risk in this model (HR: 1.96; 95% CI: 1.26–3.1; P=0.003). For PFS, tumor stage (Ta; HR: 0.20; 95% CI: 0.10–0.43; P<0.001), receipt of BCG (HR: 0.23; 95% CI: 0.10–0.52; P<0.001), and LC1 membership (HR: 0.58; 95% CI: 0.37–0.90; P<0.001) were each protective, while LC2 was associated with increased risk of progression (HR: 2.39; 95% CI: 1.26–4.50; P=0.007; Table 3).
Discovery and validation of a single‐sample transcriptomic classifier. To assess whether our lncRNA‐based classification captured prognostic differences beyond the UROMOL cohort, we trained a single‐sample transcriptomic classifier (TC) and applied it to high‐risk NMIBC tumors from an independent dataset (Knowles, n=120).
The 25 of 120 tumors predicted as LC2/3 by the classifier showed biological profiles consistent with the original UROMOL clusters, including significantly lower FGFR3 (P=0.045), p53 (P=0.030), and SHH (P=0.045) pathway activity (Figure S3). These tumors also demonstrated higher median proliferation signature scores, although this difference did not reach statistical significance (Figure S3).
Importantly, despite the overall lower recurrence risk in the Knowles cohort, the classifier significantly stratified RFS (P<0.001; Figure S4A). After adjusting for tumor stage, BCG treatment, CIS, age, and sex in multivariable analysis, predicted LC2/3 status remained independently associated with increased recurrence risk (HR: 2.50; 95% CI: 1.36–4.62, P=0.003; Figure S4B)
Discussion and Conclusion
High‐risk NMIBC (ie, TaHG, T1) is marked by frequent recurrence, with T1 disease carrying a significantly greater risk of progression.36 These aggressive clinical presentations prompt intensified treatment, such as intravesical BCG or radical cystectomy. However, treatment escalation risks overtreating patients whose disease may not warrant such interventions. Accurately identifying patients at highest risk of recurrence or progression remains a major clinical challenge, highlighting the need for robust biomarkers to guide risk stratification and personalized management. In this study, we used long noncoding RNA (lncRNA) expression patterns and unsupervised consensus clustering to stratify high‐risk NMIBC into subgroups with distinct prognoses.
Historically, lncRNA expression signatures have demonstrated utility across a spectrum of bladder cancer contexts. In luminal MIBC, lncRNA profiling identified a subset of tumors with more favorable outcomes and enriched FGFR3 signaling, suggesting potential candidates for FGFR3‐targeted therapy.11,37 We and others have extended these insights to non‐muscle‐invasive disease, where lncRNA profiles revealed micropapillary‐like T1 tumors with poor PFS25 and defined molecular distinctions within the UROMOL NMIBC cohort.33 More recently, we showed that lncRNAs could uncover aggressive biology even in clinically low‐risk, low‐grade Ta tumors,32 underscoring the specificity and broad applicability of lncRNAs as molecular classifiers across bladder cancer subtypes.
Most tumors in both cohorts were classified as luminal by the TCGA and Consensus classifiers, and the LundTax model offered slightly greater granularity. However, these molecular subtyping models did not provide additional prognostic value beyond standard clinical factors such as stage. This contrasts with MIBC, where luminal tumors typically have better outcomes,11,16,37 and underscores the need for additional approaches to resolve clinically meaningful risk groups within high‐risk NMIBC. Our lncRNA clustering solution provided this refinement, identifying biologically and clinically distinct subgroups. LC1, which had the most favorable recurrence and progression outcomes, predominantly aligned with UROMOL Class 1 (the least aggressive subtype) but also captured cases from other classes. In contrast, LC2 and LC3 were composed primarily of tumours classified as Classes 2a, 2b, and 3, subtypes generally associated with higher risk.
The lncRNA‐defined clusters reflected distinct biological programs that aligned with clinical outcomes. LC1 tumors, which had the most favorable prognosis, displayed a differentiated luminal profile characterized by active FGFR3, p53 and SHH signaling features associated with less aggressive disease in MIBC.2,7 Reduced activity of proliferative pathways (G2M checkpoint, E2F targets, mitotic spindle) and lower expression of cell cycle regulators such as MKI67, ASPM, and CENPF further suggested a less proliferative phenotype. LC1 tumors also showed modest enrichment for immune‐associated transcripts, including CCL15 and PSMB10, and elevated RNH1 expression, a gene previously linked to reduced invasion and metastasis in bladder cancer. Together, these findings support the idea that favorable FGFR3‐driven luminal biology, coupled with reduced proliferation, defines a low‐risk subset within high‐grade NMIBC.
In contrast, LC2 tumors harbored a transcriptional profile associated with more aggressive behavior. This included strong upregulation of cancer‐testis antigens (MAGEA3, MAGEA6, MAGEA10) and neuroendocrine‐associated genes such as NEB and NELL2, features linked to higher tumour grade, invasion and lineage plasticity in bladder cancer. LC3 lacked a dominant biological program, sharing elements of both LC1 and LC2, and may represent a transcriptionally heterogeneous or intermediate group. Clinically, these differences aligned with outcomes: LC1 tumors had the most favorable trajectories, while LC2 was associated with the worst progression, reinforcing the biological distinction between clusters. Importantly, a classifier trained on UROMOL lncRNA profiles predicted recurrence risk in an independent, less aggressive cohort (Knowles), underscoring the potential utility of transcriptomic stratification in guiding surveillance intensity or adjuvant therapy decisions.
Limitations. This study has several limitations. First, the retrospective design may introduce bias and limits generalizability. Second, the size of the cohorts restricted subgroup analyses, such as separating TaHG from T1 tumors. Third, differences in the transcriptomic platforms between the training (UROMOL, RNA‐sequencing) and validation (Knowles, microarray) cohorts may affect classifier reproducibility and performance. In addition, the low number of progression events in Knowles limited external validation to RFS. Finally, while the classifier demonstrated prognostic value, it remains preliminary and requires further refinement and prospective validation.
Author Contributions
RW conducted the bioinformatics analyses and figure generation. TATP developed the classifier model. RB supported the bioinformatics analysis and manuscript revision. LD provided cohort data, contributed to data interpretation, and revised the manuscript. EAG supervised the study, drafted, and critically revised the manuscript and served as guarantor of the work. All authors read and approved the final manuscript.
Acknowledgements
The authors would like to thank members of the UROMOL consortium and the contributing patients for their invaluable participation. The authors also gratefully acknowledge the Knowles cohort investigators for generating and sharing their dataset.
Data Availability Statement
All data from the UROMOL cohort analyzed during the current study are available as downloadable supplemental files from the original UROMOL manuscript.19 Data from the Knowles et al 2021 cohort are available via Cell Reports Medicine.24
References
- Soukup V, Capoun O, Cohen D, et al. Prognostic performance and reproducibility of the 1973 and 2004/2016 World Health Organization grading classification systems in non‐muscle‐invasive bladder cancer: a European Association of Urology non‐muscle invasive bladder cancer guidelines panel systematic review. Eur Urol. 2017;72(5):801–813.
- Babjuk M, Burger M, Zigeuner R, et al. EAU guidelines on non‐muscle‐invasive urothelial carcinoma of the bladder: update 2013. Eur Urol. 2013;64(4):639–653.
- Klaassen Z, Kamat AM, Kassouf W, et al. Treatment strategy for newly diagnosed T1 high‐grade bladder urothelial carcinoma: new insights and updated recommendations. Eur Urol. 2018;74(5):597–608.
- Chang SS, Bochner BH, Chou R, et al. Treatment of non‐metastatic muscle‐invasive bladder cancer: AUA/ASCO/ASTRO/SUO guideline. J Urol. 2017;198(3):552–559.
- Gurbani CM, Chong YL, Choo ZW, et al. Emerging bladder‐sparing treatments for high risk non‐muscle invasive bladder cancer. Bladder Cancer. 2025;11(2):23523735251348842.
- Cookson MS, Herr HW, Zhang ZF, et al. The treated natural history of high risk superficial bladder cancer: 15‐year outcome. J Urol. 1997;158(1):62–67.
- Daniels MJ, Barry E, Schoenberg M, et al. Contemporary oncologic outcomes of second induction course BCG in patients with nonmuscle invasive bladder cancer. Urol Oncol. 2020;38(1):5.e9–5.e16.
- Lamm DL, Blumenstein BA, Crissman JD, et al. Maintenance Bacillus Calmette‐Guerin immunotherapy for recurrent TA, T1 and carcinoma in situ transitional cell carcinoma of the bladder: a randomized Southwest Oncology Group study. J Urol. 2000;163(4):1124–1129.
- Lerner SP, Dinney C, Kamat A, et al. Clarification of bladder cancer disease states following treatment of patients with Intravesical BCG. Bladder Cancer. 2015;1(1):29–30.
- Batista da Costa J, Gibb EA, Bivalacqua TJ, et al. Molecular characterization of neuroendocrine‐like bladder cancer. Clin Cancer Res. 2019;25(13):3908–3920.
- de Jong JJ, Liu Y, Robertson AG, et al. Long non‐coding RNAs identify a subset of luminal muscle‐invasive bladder cancer patients with favorable prognosis. Genome Med. 2019;11(1):60.
- Koll FJ, Doring C, Herwig L, et al. Impact of consensus molecular subtypes on survival with and without adjuvant chemotherapy in muscle‐invasive urothelial bladder cancer. J Clin Pathol. 2023;78(1): 208973.
- Kollberg P, Chebil G, Eriksson P, et al. Molecular subtypes applied to a population‐based modern cystectomy series do not predict cancer‐specific survival. Urol Oncol. 2019;37(10):791–799.
- Reike MJ, de Jong JJ, Bismar TA, et al. Alignment of molecular subtypes across multiple bladder cancer subtyping classifiers. Urol Oncol. 2024;42(6):177.e5–177.e14.
- Kamoun A, de Reynies A, Allory Y, et al. A consensus molecular classification of muscle‐invasive bladder cancer. Eur Urol. 2020;77(4):420–433.
- Robertson AG, Kim J, Al‐Ahmadie H, et al. Comprehensive molecular characterization of muscle‐invasive bladder cancer. Cell. 2017;171(3):540–556.e25.
- Seiler R, Ashab HAD, Erho N, et al. Impact of molecular subtypes in muscle‐invasive bladder cancer on predicting response and survival after neoadjuvant chemotherapy. Eur Urol. 2017;72(4):544–554.
- Sjodahl G, Eriksson P, Liedberg F, Hoglund M. Molecular classification of urothelial carcinoma: global mRNA classification versus tumour‐cell phenotype classification. J Pathol. 2017;242(1):113–125.
- Lindskrog SV, Prip F, Lamy P, et al. An integrated multi‐omics analysis identifies prognostic molecular subtypes of non‐muscle‐invasive bladder cancer. Nat Commun. 2021;12(1):2301.
- Robertson AG, Groeneveld CS, Jordan B, et al. Identification of differential tumor subtypes of T1 bladder cancer. Eur Urol. 2020;78(4):533–537.
- Marzouka NA, Eriksson P, Bernardo C, et al. The Lund molecular taxonomy applied to non‐muscle‐invasive urothelial carcinoma. J Mol Diagn. 2022;24(9):992–1008.
- Olislagers M, de Jong FC, Rutten VC, et al. Molecular biomarkers of progression in non‐muscle‐invasive bladder cancer ‐ beyond conventional risk stratification. Nat Rev Urol. 2024;22(2):75–91.
- de Jong FC, Laajala TD, Hoedemaeker RF, et al. Non‐muscle‐invasive bladder cancer molecular subtypes predict differential response to intravesical Bacillus Calmette‐Guerin. Sci Transl Med. 2023;15(697):eabn4118.
- Hurst CD, Cheng G, Platt FM, et al. Stage‐stratified molecular profiling of non‐muscle‐invasive bladder cancer enhances biological, clinical, and therapeutic insight. Cell Rep Med. 2021;2(12):100472.
- de Jong JJ, Valderrama BP, Perera J, et al. Non‐muscle‐invasive micropapillary bladder cancer has a distinct lncRNA profile associated with unfavorable prognosis. Br J Cancer. 2022;127(2):313–320.
- Luo J, Luo F, Li Q, et al. An immunogenic cell death‐related lncRNA signature correlates with prognosis and tumor immune microenvironment in bladder cancer. Sci Rep. 2024;14(1):13106.
- Qiao Y, Tian X, Li S, Niu H. Identification and experimental validation of a sialylation‐related long noncoding RNA signature for prognosis of bladder cancer. BMC Urol. 2024;24(1):222.
- Gutschner T, Diederichs S. The hallmarks of cancer: a long non‐coding RNA point of view. RNA Biol. 2012;9(6):703–719.
- Mattick JS, Amaral PP, Carninci P, et al. Long non‐coding RNAs: definitions, functions, challenges and recommendations. Nat Rev Mol Cell Biol. 2023;24(6):430–447.
- Beylerli O, Gareev I, Sufianov A, et al. Long noncoding RNAs as promising biomarkers in cancer. Noncoding RNA Res. 2022;7(2):66–70.
- Gibb EA, Brown CJ, Lam WL. The functional role of long non‐coding RNA in human carcinomas. Mol Cancer. 2011;10(1):38.
- de Jong JJ, Black PC, Dyrskjot L, Gibb EA. Long noncoding RNAs identify a subgroup of patients with low‐grade non‐muscle‐invasive bladder cancer with less favorable outcomes. Eur Urol Oncol. 2025;8(4):879–882.
- Hedegaard J, Lamy P, Nordentoft I, et al. Comprehensive transcriptional analysis of early‐stage urothelial carcinoma. Cancer Cell. 2016;30(1):27–42.
- Cotillas EA, Bernardo C, Veerla S, et al. A versatile and upgraded version of the LundTax classification algorithm applied to independent cohorts. J Mol Diagn. 2024;26(12):1081–1101.
- Liberzon A, Birger C, Thorvaldsdottir H, et al. The molecular signatures database (MSigDB) hallmark gene set collection. Cell Syst. 2015;1(6):417–425.
- Kamat AM, Hahn NM, Efstathiou JA, et al. Bladder cancer. Lancet. 2016;388(10061):2796–2810.
- de Jong JJ, Proudfoot JA, Daneshmand S, et al. A luminal non‐coding RNA‐based genomic classifier confirms favourable outcomes in patients with clinically organ‐confined bladder cancer treated with radical cystectomy. BJU Int. 2025;135(4):648–656.